




Updated 22 October 2026.
DigiStreet field guide
What the Intex and JBM GEO Case Studies Show
Intex recorded 281K impressions and JBM Group recorded 237K impressions in Google’s generative-AI features over the three months to 21 September 2026. The daily lines matter more than a dramatic comparison total.
The Intex and JBM Group case pages use the same dated source: each brand’s Google Search Console Generative AI features report, captured 21 September 2026. Intex shows 281K impressions for the last three months. JBM Group shows 237K. Both pages explain that the earlier comparison period contains only about one month of data.
That matters because a rounded headline comparison can exaggerate the change. The Intex case reads the periods as roughly 2,100 impressions a day earlier and 3,050 in the later period. JBM Group moves from roughly 2,200 to 2,600 a day. The daily reading is slower and more believable.
The two sites also offer different kinds of evidence. Intex has a consumer electronics catalogue with products, categories, prices and specifications. JBM Group has industrial and automotive facts such as applications, capacity and certifications. Both give answer systems facts that can be attributed.
Use this guide as a working document: keep the URL, date, owner and source beside every decision.
The working view
| Case | Latest period | Earlier daily reading | Latest daily reading |
|---|---|---|---|
| Intex | 281K impressions, three months | About 2,100 | About 3,050 |
| JBM Group | 237K impressions, three months | About 2,200 | About 2,600 |
| Shared source | Search Console Generative AI features | Earlier period about one month | Captured 21 September 2026 |
| Measurement boundary | Impressions in an AI feature | No click total in this report | Keep web-search clicks separate |
Read both cases without flattening the differences
Start with the report label
Both case pages name Google Search Console’s Generative AI features report and its beta status. That is better evidence than a third-party visibility score because the property owner can see the dated source. Preserve the label whenever the chart is reused.
Compare equal days
The earlier total in each chart is not a full three months. Divide by the actual period before discussing direction. Intex’s daily movement is larger than JBM Group’s, even though both rounded comparison totals can tempt a more dramatic claim.
Treat an impression as visibility
The report counts appearances inside the feature. It does not supply the same click path as the ordinary web performance report. Keep AI impressions, web clicks and site key events on separate lines so one cannot be mistaken for another.
Product facts give Intex retrieval material
A catalogue page can state screen size, capacity, price, ratings and availability. Category structure connects those facts to the brand and product family. That creates clear material for comparison questions without adding vague paragraphs written only for a machine.
Industrial facts give JBM a different route
Manufacturing pages can state applications, certifications, capacity and part-level detail. Those facts help procurement research and technical comparisons. They need to be visible on stable pages rather than trapped in brochure files.
One brand can need several evidence layers
The Intex engagement described on the case page covers its store, marketplace creatives, social work, video and SEO. The GEO chart sits on top of that broader digital surface. A useful review therefore checks brand consistency and factual pages together.
A weekly rhythm can explain a B2B line
The JBM Group case observes a regular dip and recovery in the chart, consistent with weekday-led B2B research. That is a reading of the visible pattern, not a new performance metric. Keeping observations separate from measured totals makes the report easier to audit.
Captures still matter for answer text
Search Console provides the impression line. Dated captures show how an answer names the company and which sources it cites. Save the query, date, surface, answer and cited URL together. A cropped logo or isolated quote is weak evidence.
Page changes need a dated ledger
When a specification, category explanation or source citation is improved, record the URL and date. Later visibility can then be read against a real change. Without that ledger, a rising line may be interesting but cannot guide the next page decision.
Use the cases to set reporting discipline
The strongest lesson is the method: named property, named report, exact period, visible chart and restrained reading. Apply that method to your own site before comparing it with another brand or buying a broad visibility score.
What to copy from the case-study method
First, name the property and source beside the chart. “AI visibility increased” is too loose to audit. “Google Search Console, intex.in, Generative AI features, captured 21 September 2026” gives a reader enough information to understand the system, site and date.
Second, describe the period as it exists. A comparison label can say three months while the earlier line contains only the data available since the report began. Count the days represented before writing a multiple. The Intex and JBM pages both improve their reading by moving from rounded totals to daily averages.
Third, connect the graph to page material a reader can inspect. For Intex that includes category and product facts. For JBM Group it includes industrial applications and company facts. The case is more useful when it shows what was published than when it treats visibility as an unexplained score.
Fourth, separate observations from measurements. A weekly rhythm, a visible step up or a recurring query theme can guide investigation, but it is not a new total. Label calculated averages as approximate and keep the raw source image available.
Fifth, decide the next page action. A case study should help another team inspect specifications, source labels, page structure and internal links on its own site. The point is not to copy Intex or JBM wording. It is to adopt the same evidence discipline.
How to sanity-check a GEO chart before anyone sees it
Multiply the daily average back up
Take the later daily reading and multiply it by the days in the period. For Intex, a daily reading of about 3,050 should land close to the 281K total across three months. If the product comes out far lower or higher, the chart has a gap, a spike or an average calculated over the wrong days. Do it before the chart goes into a deck, and write the result next to the image so a reader can repeat it. If your own site is small, the same sum works on a single week: seven days at the daily average should match the weekly total you see when you hover over the line.
Mistakes that make a visibility chart misleading
Four slips turn up again and again. The date range is cropped out of the screenshot. Two properties are added together without saying so. A beta report is described as final. A brand with a large catalogue is compared with a brand that has a handful of pages. Each one is easy to spot once you look for it, and each one is cheap to fix at the start. Ask who captured the image, on which day, from which property, and whether the full axis is visible. A chart that starts its vertical axis above zero makes a small rise look like a jump, so check the axis labels first.
What to ask a vendor who sends you a visibility score
Ask which surface the score measures and whether it comes from your own Search Console or from a third-party sample of queries. Ask for the query list behind it, the capture date and a raw export you can open yourself. Ask how impressions are kept apart from clicks. A vendor who can answer all four in one email is working from evidence. One who sends a single number with a colour band is selling a picture, and you cannot audit a picture. Ask the same questions of your own team, because an internal report built from screenshots needs the same discipline.
A decision rule for a small business with a short catalogue
A company with a few dozen product or service pages will see daily impressions swing from one day to the next. Judge that kind of site on weekly totals, and compare the same weekdays. Change one page at a time and note the date. If the weekly line has not moved after two full weeks, look at whether the facts on the page answer a real question a buyer asks, such as capacity, price band or delivery area. Fix the page content before you add more pages. A single page that states the facts a buyer asks about clearly is a better test than five thin pages that repeat each other.
Evidence from DigiStreet work
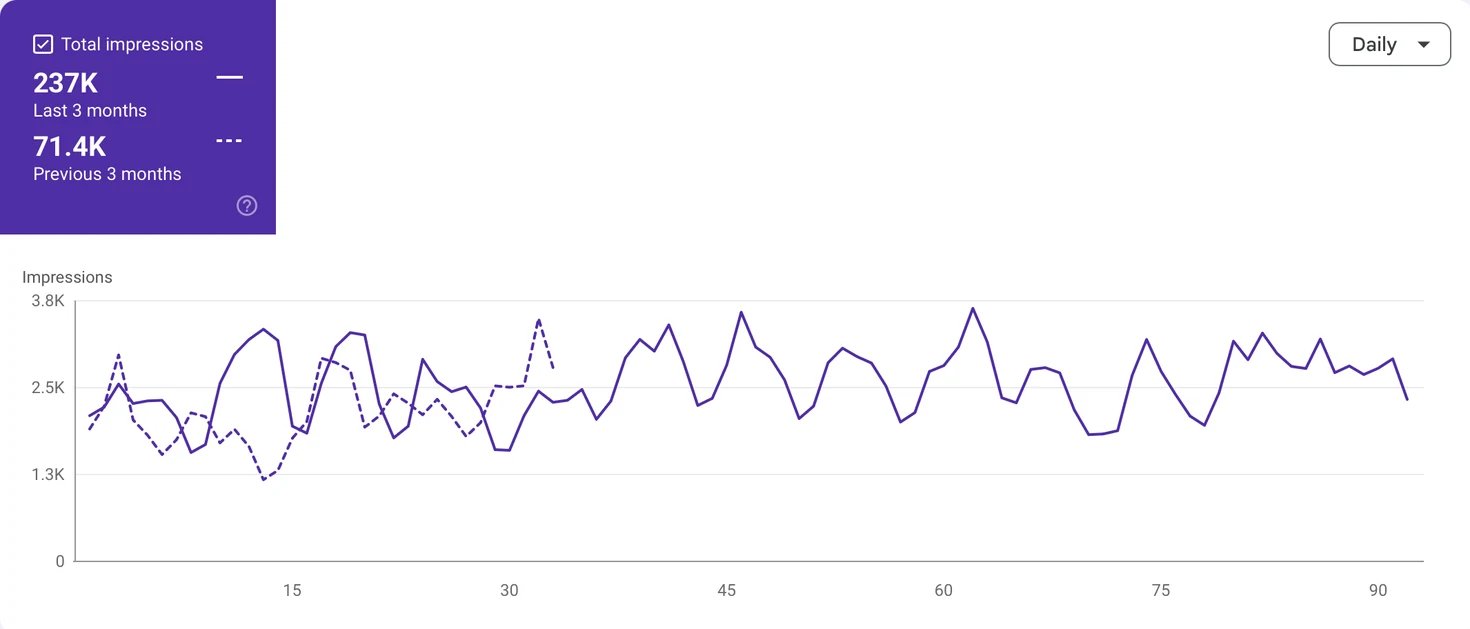
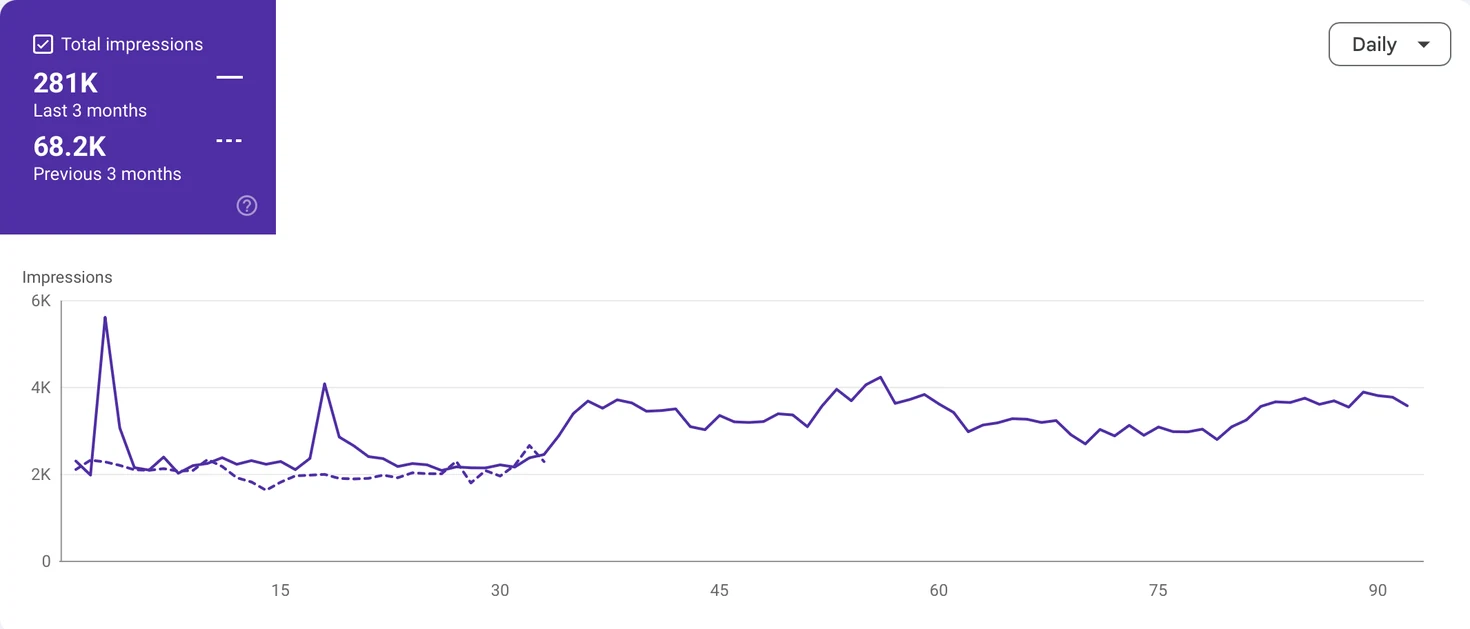
The two charts belong beside their published case pages because those pages state the property, period and reading. Reusing the image without that context would turn evidence into decoration.
For a new review, open the report, save the full period and then inspect the pages shown for the relevant questions. The useful action is usually on the page that supplies the fact.
Questions people ask before using this guide
What did Intex record in the latest period?
Search Console showed 281K generative-AI feature impressions over the three months to 21 September 2026.
What did JBM Group record?
Search Console showed 237K generative-AI feature impressions over the same stated period.
Can the earlier totals be compared directly?
Use daily averages because the earlier comparison contains only about one month of data.
Do these impressions equal clicks?
No. The case pages describe impressions in the AI feature; web clicks are measured separately.
What page material helps a manufacturer?
Visible applications, specifications, certifications, capacity and stable product-family explanations.
Where can I read the full cases?
Use the Intex GEO and JBM Group GEO case-study links in the sources below.
Put the next decision on one page
Bring the URL, the evidence you already have and the business action that matters. We will tell you what should be checked first.