
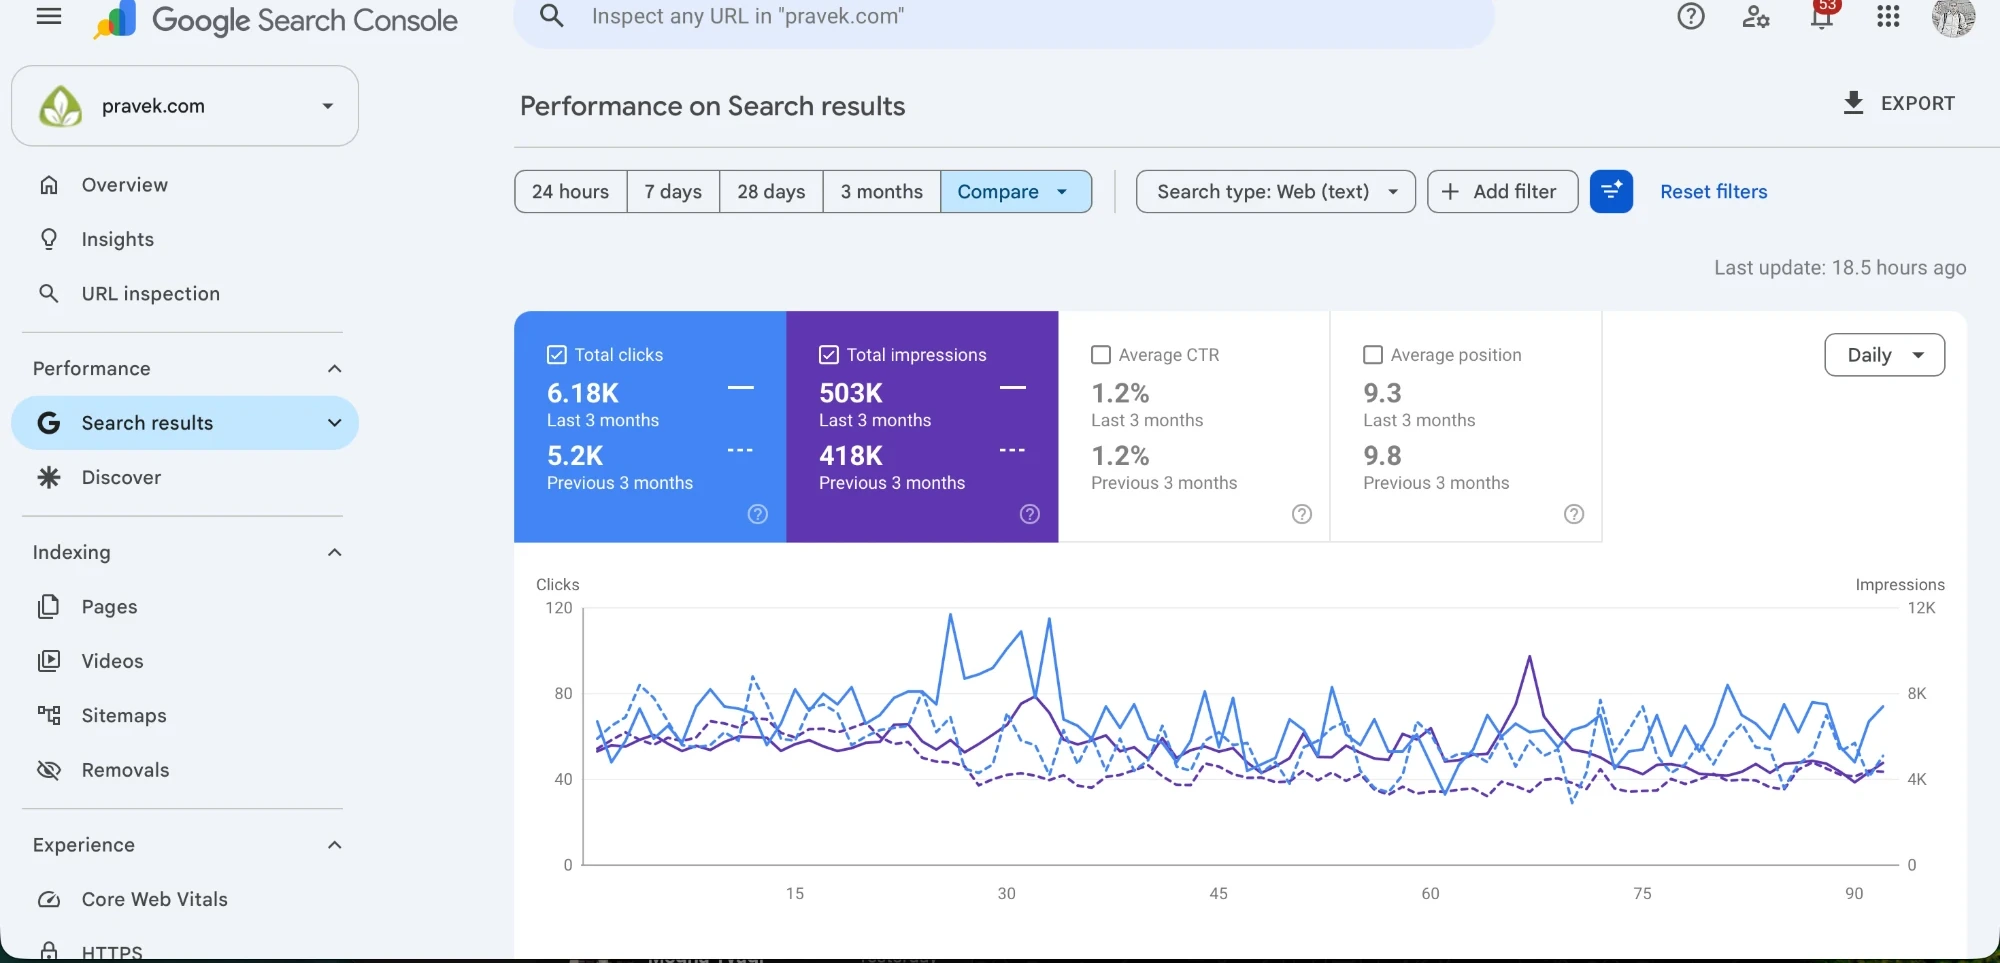
Our six-month case study compared against a baseline that was barely a few weeks old, which made some of the numbers hard to read cleanly. Here are the two most recent quarters compared directly instead: clicks up 19% to 6.18K, impressions up 20% to 503K, and average position improving from 9.8 to 9.3.
Client: pravek.com
Our six-month case study compared 11.4K clicks against a prior six months of just 1.74K — and said plainly that the earlier window held only about five weeks of real data, because Google had barely indexed the site before that. It's still the fuller account, with the engagement and order detail this page doesn't repeat: Pravek Kalp SEO case study: six months to September 2026 →
That near-empty baseline distorted more than the headline number. Average position in that comparison moved from 7.9 to 9.5 — worse, on paper — because ranking for eight times as many queries pulls the average down even as the site improves. This page compares two full quarters instead, both with substantial data, which is a fairer test of what's actually happening now.
Nothing changed in the approach between the two case studies — this page exists to measure it better, not to describe something new:
Between July and September 2026, Pravek Kalp's store took 6.18K clicks from Google Search, against 5.2K the quarter before — up 19%. Impressions rose from 418K to 503K, up 20%. Click-through rate held flat at 1.2% in both quarters. Average position improved from 9.8 to 9.3.
| Metric | Previous 3 months | Last 3 months | Change |
|---|---|---|---|
| Clicks | 5.2K | 6.18K | +19% |
| Impressions | 418K | 503K | +20% |
| Average CTR | 1.2% | 1.2% | Flat |
| Average position | 9.8 | 9.3 | Better by 5% |
This is a more even result than the six-month headline, and we think a more trustworthy one: clicks and impressions grew together, at almost the same rate, while the site also climbed half a position. A flat click-through rate alongside rising impressions and improving position is not a weak result — it means the growth came from reaching more searches and ranking higher in them, rather than from a CTR fluke in one quarter. It's also consistent with the order growth reported in the six-month case study: more than 150 organic orders a month as of September 2026.
Source: Google Search Console, pravek.com, search type web (text), last three months against the previous three, captured 1 October 2026. Figures are shown as Search Console rounds them.
The first one's comparison baseline was mostly empty — about five weeks of real data against eleven years of a live Search Console property. That made the position and CTR changes hard to trust. This page compares two full quarters instead, which is a cleaner test.
Yes. The two most recent quarters here add up to roughly the six-month totals already reported. This page is a different cut of mostly the same period, not a contradiction.
Because the six-month comparison's earlier window barely existed as data, which distorts an average. Comparing two full quarters removes that distortion, and the fair read is that position is improving: 9.8 to 9.3.
Not necessarily. It held steady while impressions and clicks both rose by about a fifth, which means the growth came from broader visibility and better ranking, not a one-off CTR spike. It does suggest there may be room to improve titles and meta descriptions for the highest-impression queries.
This page is ordinary organic Search Console performance. The separate GEO case study covers how often Pravek Kalp appears inside Google's AI-generated answers. Read the Pravek Kalp GEO case study →
Yes, particularly where the product involves some research before purchase. Start a conversation →
If a before/after number in your own reporting looks too good or too odd, send us the property and we'll check it.
Talk to us
Awarded Digital Marketing Agency
Over 100
 reviews


