
Pravek Kalp sells Ayurvedic wellness products online. In the six months to September 2026, Google Search sent the store 11.4K clicks from 932K impressions, and organic search now brings in more than 150 orders a month. At the start of the six months before that, Search Console shows the site close to zero.
Client: pravek.com
Ayurvedic products are not bought on impulse. A buyer researches the formulation, what it is indicated for, how it is taken and whether the brand is credible — often across several visits before purchasing.
That makes ecommerce SEO here unusual. Ranking a product page is not enough, because the person searching is usually not yet at the product stage. They are asking what a formulation does, whether it suits their condition, and how it compares to the alternative they were told about.
A catalogue that only answers “buy this” loses that visitor to whichever site answered the question first.
Between late March and late September 2026 the store took 11.4K clicks from Google Search on 932K impressions. For the six months before that, Search Console reports 1.74K clicks and 117K impressions.
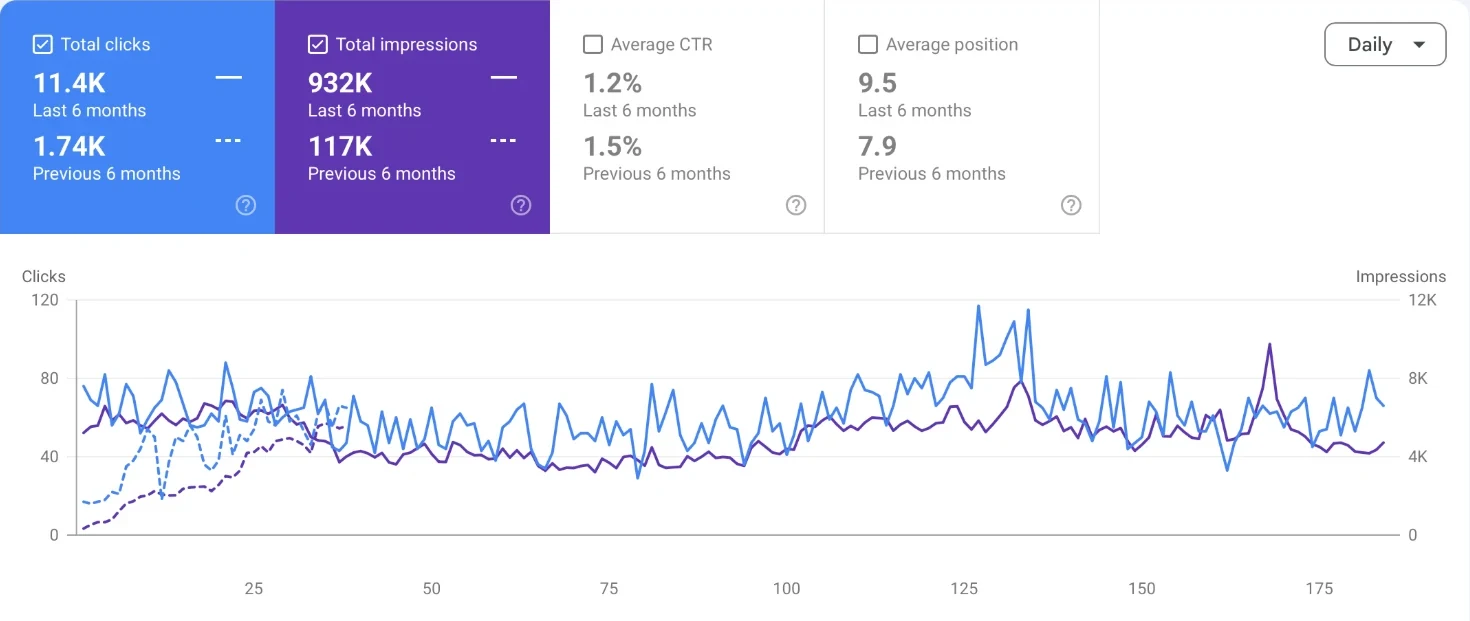
Read the comparison carefully, because the chart says more than the totals do. The dotted line for the earlier period runs for about five weeks and begins close to zero. Google had barely met this site then. So this is not a store whose traffic grew six and a half times. It is a store that went from nearly invisible to somewhere between 50 and 80 clicks on most days, with a best day near 117, and held that level for six months.
Average position moved from 7.9 to 9.5 and click-through rate from 1.5% to 1.2%. Both look like a step back and are the opposite. A site shown for eight times as many searches is now appearing for plenty of queries where it sits lower on the page, and those pull the averages down while the click total climbs.
The number the client cares about is orders. Organic search now brings in more than 150 a month. We publish the order count and leave revenue out, because order value is Pravek’s to disclose and not ours.
| Metric | Previous six months | Last six months |
|---|---|---|
| Clicks | 1.74K | 11.4K |
| Impressions | 117K | 932K |
| Average CTR | 1.5% | 1.2% |
| Average position | 7.9 | 9.5 |
Source: Google Search Console, pravek.com, search type web, last six months against the previous six, captured 21 September 2026. Figures are shown as Search Console rounds them. The earlier period holds roughly five weeks of data. Daily figures are read from the chart. Order count: orders attributed to organic search, September 2026.
The same pages are also being shown inside Google’s AI answers. That is written up separately: Pravek Kalp GEO case study →
The six-month comparison above used a baseline that was mostly empty. For a cleaner read using two full quarters: Pravek Kalp SEO case study, Q3 2026 update →
Between 1 February and 15 August 2026, organic channels delivered 4,565 sessions, with organic search alone accounting for 3,917 — 85.81% of that organic total. Organic search also produced 86.25% of all recorded events.
The headline movements are depth rather than volume. Average engagement time rose 33.57% to 1m 02s, and events per session rose 21.86% to 8.04. Organic visitors outperformed the site average on both, at 1m 06s and 8.09 events.
Engagement rate held at 60.68% overall, with organic search slightly ahead at 61.68%. Holding engagement rate steady while session depth rises by a fifth is the signature of content that answers a question properly — people stay because there is more worth reading, not because they are lost.
| Metric | All organic channels | Organic search |
|---|---|---|
| Sessions | 4,565 | 3,917 (85.81%) |
| Engaged sessions | 2,770 | 2,416 (87.22%) |
| Engagement rate | 60.68% | 61.68% |
| Avg. engagement time | 1m 02s | 1m 06s |
| Events per session | 8.04 | 8.09 |
| Event count | 36,722 | 31,674 (86.25%) |
Source: Google Analytics 4, 1 February – 15 August 2026, traffic acquisition by session primary channel group. Figures cover the organic channel group (search, social, shopping and video), which represents 20.73% of total site sessions; percentage shares shown are of that organic group, not of all site traffic. Engagement time and events-per-session changes are against the comparison window.
In a considered-purchase category, session depth is a leading indicator of revenue in a way raw sessions are not. Someone viewing eight pages of formulation detail is materially closer to buying than someone who bounced off a category page, and far more likely to return.
It is also why we report the organic group as a share of itself and state plainly that it is 20.73% of total site traffic. Presenting 85.8% without that context would imply organic dominates the whole site, which it does not — yet.
The buyer researches before they shop. In most ecommerce the search is transactional - a product name, a price comparison. In Ayurveda and wellness the search usually starts informational: what a formulation does, whether it suits a condition, how it is taken. Winning means ranking for those questions and linking through to the product, rather than competing only on product-page terms.
That is what Search Console reports, 11.4K against 1.74K, and it overstates the change. The earlier six months hold about five weeks of data, because Google had only just started showing the site. The fair summary is a store that built from almost nothing to 11.4K clicks in six months and kept that level.
Because an order count is something we can state without disclosing what is not ours to disclose. Order value and margin belong to Pravek. Clicks and impressions come from Search Console, engagement from Google Analytics, and the Search Console chart is on this page so you can check the totals against it.
It means organic search delivered 85.81% of sessions within the organic channel group - search, social, shopping and video combined. That organic group is 20.73% of total site sessions. We state it this way deliberately; quoting 85.8% without the denominator would misrepresent the site's overall channel mix.
It is solid. Ecommerce engagement rates vary widely by category, but for a considered-purchase wellness catalogue a 60.68% overall rate with organic at 61.68% indicates most sessions are meaningful rather than accidental. The more encouraging signal is that it held steady while session depth rose over 20%.
Yes - research-first buying behaviour is common across supplements, nutraceuticals and traditional medicine. What must be handled carefully is claims: health content sits under stricter scrutiny for accuracy and authority, so it has to be genuinely informative rather than promotional to earn and keep rankings.
We wrote up the approach used on this account in more depth: Ecommerce SEO for wellness brands: winning the research stage.
If your buyers ask questions before they add to cart, your product pages are only half the job. We can map the research path and build the content that owns it.
Talk to us
Awarded Digital Marketing Agency
Over 100
 reviews


