


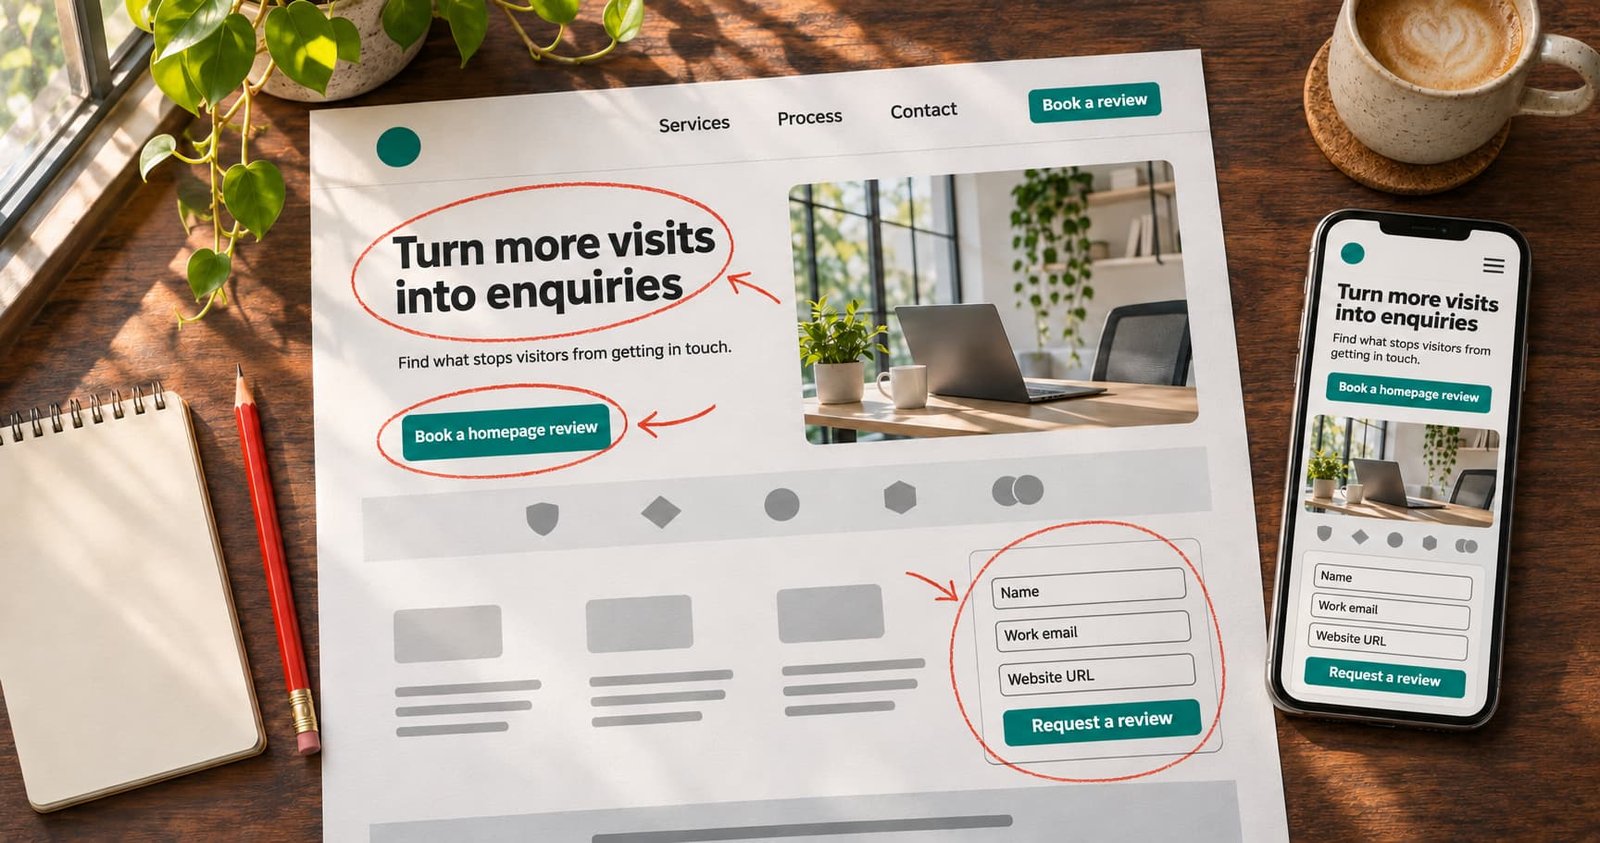
The best way to see how this works is to look at a page. Below is a made-up homepage for an imaginary B2B software services firm. We will walk through it from top to bottom, mark the problems and show the fix for each. We invented the firm and its numbers for illustration.
The Starting Page
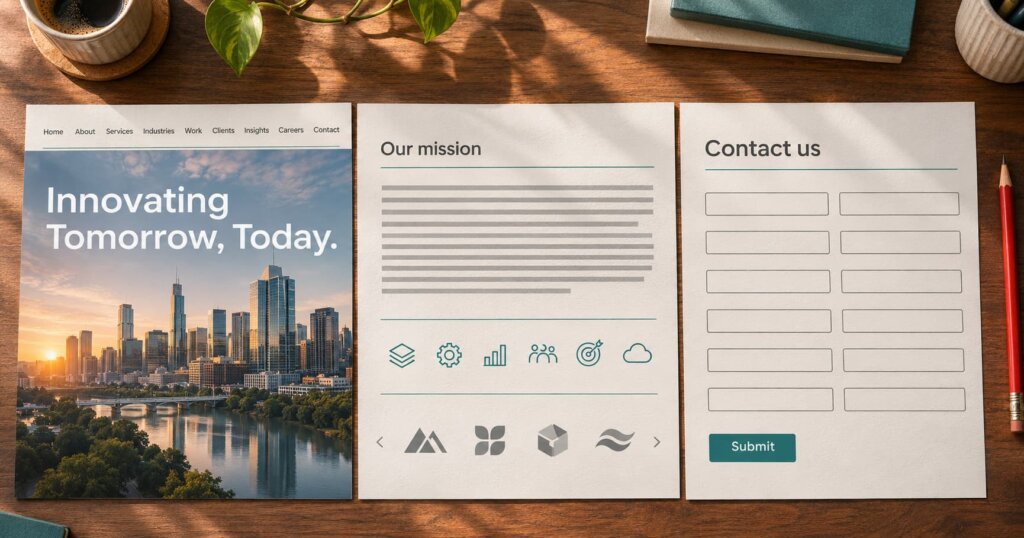
Picture a homepage with this layout:
- A full-screen photo of a skyline with the headline “Innovating Tomorrow, Today.”
- A menu with nine links.
- A paragraph about the company’s mission.
- A row of six icons for services, each linking to a long page.
- A carousel of client logos.
- A footer with a contact form that asks for twelve fields.
Visitors come from Google Ads and from organic search. Most leave within ten seconds. Let us see why.
Teardown Point 1: The Headline Says Nothing
“Innovating Tomorrow, Today” could belong to any company. A visitor who arrives from the search “ERP integration services for manufacturers” needs proof within seconds that this page matches that need.
Fix. Write a headline that names the audience, the service and the benefit. For example: “ERP integration for manufacturers, live in 12 weeks with no production downtime.” Only claim what you can deliver. Add one sentence below that explains how you do it.
Rule of thumb: a stranger should explain your offer after five seconds on the page.
Teardown Point 2: No Clear Next Step Above the Fold
The visitor sees a photo and a menu, but no button. The contact form sits at the bottom.
Fix. Place one primary button near the top, with action words that describe the result. “Book a free 20-minute assessment” works better than “Submit” or “Learn more.” Repeat the same button after each major section. Keep a secondary option, such as a phone number or WhatsApp link, for people who prefer to talk.
Teardown Point 3: Too Many Menu Choices
Nine links split attention. Visitors who want one thing must scan eight others.
Fix. Cut the menu to five or six links. Keep Services, Industries, Case studies, About and Contact. Make the contact button stand apart in colour. On mobile, check that the menu opens smoothly and that the button stays reachable.
Teardown Point 4: Services Without Context
Six icons look neat, but they hide the value. A decision maker wants to know which problems you solve and for whom.
Fix. Replace icons with short problem-led blocks. Each block gets a title, one line on the problem, one line on the outcome and a link. For example: “Slow order processing? We connect your ERP to your shop floor so orders flow without re-entry.” This style matches how buyers think and how they search.
Teardown Point 5: Proof Arrives Too Late and Too Thin
A carousel of logos shows that you have worked with someone, but it says nothing about results. Carousels also move before many users can read them.
Fix. Use a static row of logos, and add two short case snippets with real details: the client’s sector, the problem, what you did and the outcome. Use real figures only, and only with the client’s permission. Add a named testimonial with a role and company. If you cannot share names, say “a mid-sized auto parts maker in Pune” and keep the story honest.
Teardown Point 6: The Form Asks for Too Much
Twelve fields feel like an exam. People abandon long forms, especially on phones.
Fix. Ask for what you need to start the conversation: name, work email, phone number and a short message. Add one optional field for budget or timeline if your team truly uses it. Explain what happens next: “We reply within one working day.” Add a short privacy note. If you need more detail, collect it on a call or in a second step.
Check the basics too:
- The form works on mobile with the right keyboard type for each field.
- Error messages say exactly what to correct.
- A thank-you page confirms the submission and offers a next action, such as booking a time.
Teardown Point 7: Slow and Heavy Pages
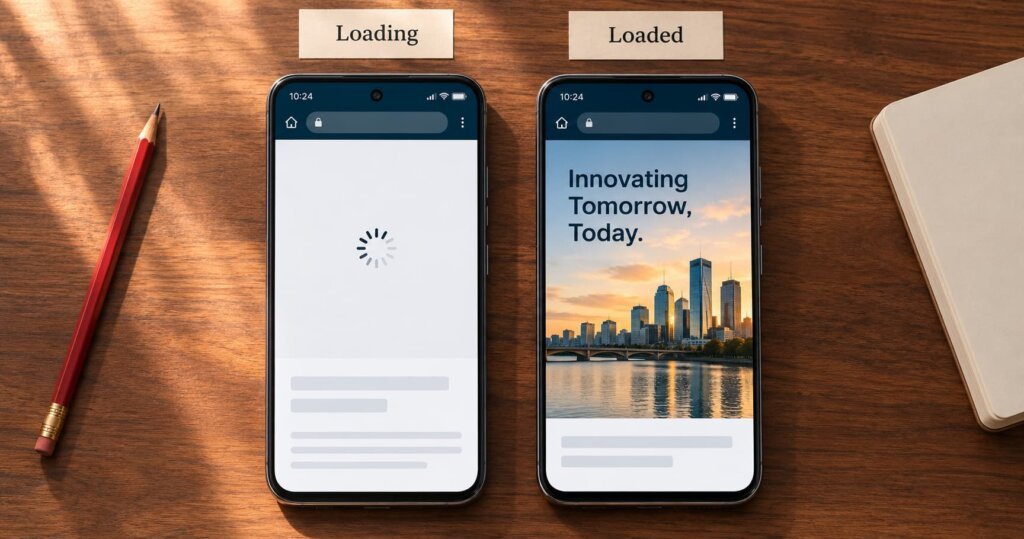
The full-screen photo is large, and the page loads slowly on a mobile network. Slow pages lose visitors before the headline appears.
Fix. Compress images, use modern formats, load below-the-fold images lazily and remove unused scripts. Test with Google’s PageSpeed tools and aim to improve the Core Web Vitals scores they report. Test on a real mid-range phone, not only on a fast office computer.
Teardown Point 8: No Measurement
The firm cannot tell which button or form brings leads, so it cannot improve anything with confidence.
Fix. Set up analytics events for form starts, form submissions, button clicks, phone taps and booking confirmations. Mark the important ones as key events. Our guide on GA4 key events for lead generation sites shows which ones to track.
Also record where the lead came from and whether sales accepted it. A rise in form fills means little if the leads are poor.
What the Fixed Page Looks Like
After the changes, the same page runs like this:
| Section | Before | After |
|---|---|---|
| Headline | Slogan with no meaning | Audience, service and outcome in one line |
| Main button | None above the fold | One clear button, repeated down the page |
| Menu | Nine links | Five or six links plus a contact button |
| Services | Six icons | Four problem-led blocks |
| Proof | Logo carousel | Static logos, two case snippets, a named quote |
| Form | Twelve fields | Four fields and a promise of reply time |
| Speed | Large hero image | Compressed images and lazy loading |
| Tracking | None | Key events and lead source records |
This is an illustration. Real results depend on traffic quality, offer, price, sector and sales follow-up, so treat any improvement figure you hear with care.
How Conversion Rate Optimisation Services Work
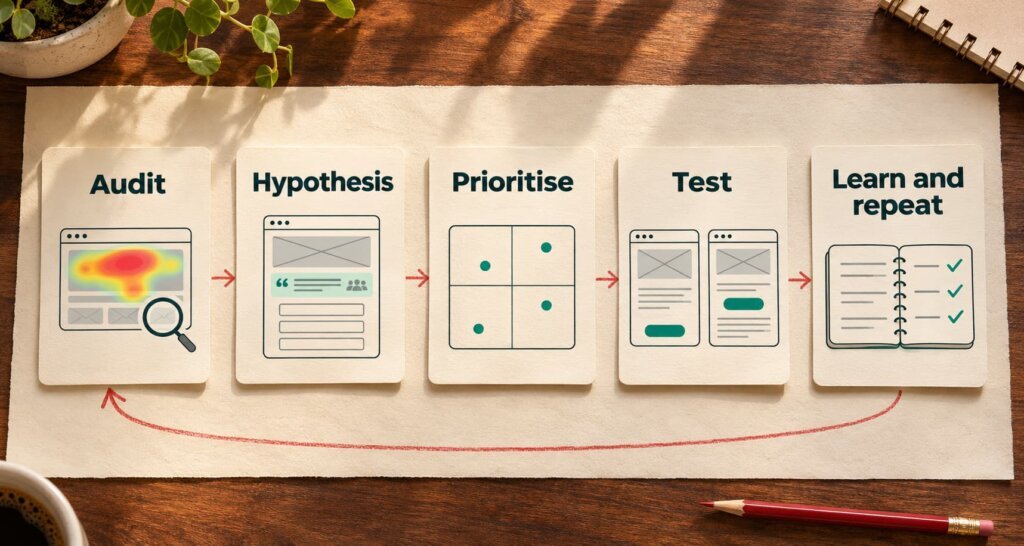
A serious CRO engagement follows a repeatable cycle.
1. Audit. The team reviews analytics, heatmaps, session recordings, form data and page speed. It also reads sales call notes and chat logs to learn the objections buyers raise.
2. Hypothesis. For each problem, the team writes a clear guess: “If we move the proof above the form, more visitors will start the form.”
3. Prioritise. The team ranks ideas by likely impact, effort and traffic. A change on a page with 50 visits a month will not give a reliable test.
4. Test. The team runs A/B tests when traffic is high enough. On low-traffic sites, it makes careful changes and compares before and after periods, then notes the limits of that method.
5. Learn and repeat. Each test adds to a log of what works for your audience.
Be wary of providers who promise a fixed lift, such as “double your conversions.” Honest teams talk about process, evidence and learning.
When Should You Invest in CRO?
CRO makes most sense when:
- You already get steady traffic, even a few thousand visits a month.
- Your cost per lead is rising and ad budgets are tight.
- You see many visits but few enquiries.
- You plan a redesign and want to base it on evidence.
If traffic is very low, fix basics first, such as clear messaging, speed and tracking. Then work on traffic. If you sell online, our guide to conversion rate optimisation for e-commerce stores in India covers product pages and checkout.
A Quick Self-Check
Open your homepage on your phone and ask:
- Can I tell in five seconds what this company does and for whom?
- Can I find a clear next step without scrolling?
- Do I see proof that looks real?
- Can I complete the form in under a minute?
- Does the page load fast?
Two or more “no” answers mean you have easy wins waiting.
Get a Fresh Pair of Eyes
Our performance marketing team and our website design team work together on audits, page changes and tracking, so fixes reach the page quickly. If you want a teardown of your own homepage, send us the link through our contact page and we will list the changes most likely to help.
Reference Links
| Relevant Topic or Resource | Why It Is Relevant | Verified Link |
|---|---|---|
| Google guidance on Core Web Vitals | Explains page experience metrics that affect speed and usability | web.dev/articles/vitals |
| Google guidance on creating helpful, people-first content | Supports clear, useful messaging on key pages | developers.google.com/search/docs/fundamentals/creating-helpful-content |
| Schema.org FAQPage | Reference for FAQ markup used on answer pages | schema.org/FAQPage |
FAQs
What are conversion rate optimisation services?
They are services that improve the share of website visitors who take a goal action, such as filling a form, calling or booking. They use analytics, user research, design changes and testing.
How much do conversion rate optimisation services cost in India?
Pricing depends on scope, traffic and how many tests you want. Ask for a written plan that lists audits, tests, reporting and the people involved before you sign.
What is a good conversion rate for a lead generation website?
It varies by sector, traffic source, offer and price. Compare your own results over time instead of chasing a single benchmark, and track lead quality alongside volume.
How long does CRO take to show results?
Simple fixes can show effects within weeks. Testing programmes often need several months to collect enough data and build learning.
Do I need A/B testing to improve conversions?
No. A/B tests need high traffic to give reliable results. Lower-traffic sites can still gain from clearer messaging, shorter forms, faster pages and better proof.
What is the difference between CRO and SEO?
SEO brings more visitors from search. CRO helps more of the visitors you already have take action. The two work best together.
Which tools help with conversion rate optimisation?
Common choices include analytics platforms, heatmap and session recording tools, form analytics and A/B testing tools. The process and the thinking matter more than the tool.