
Sirca Paints has been our client for years, and our earlier case study covered 2022 to 2024. This is the current picture. From 1 January to 21 September 2026 Google Search sent the site 50,051 clicks, against 26,710 in the 264 days before, while its average position moved from 16.6 to 9.5.
Our earlier Sirca Paints SEO case study covered 2022 to 2024 and reported 53% more visitors and 285% more business queries. It is still the account of how the relationship began: Sirca Paints SEO case study, 2022 to 2024 →
This one measures the current period. It uses Search Console figures brought into Google Analytics 4, which means clicks, impressions, click-through rate and average position. Those are numbers a marketing team can open and check for itself.
We have not changed the method, and this page does not pretend to add a new one. The engagement continues on the footing described in the earlier case study:
What this page adds is a current measurement.
Between 1 January and 21 September 2026, Sirca’s site took 50,051 organic clicks from Google Search. In the 264 days from 10 April to 29 December 2025 it took 26,710. That is an increase of 87.39%.
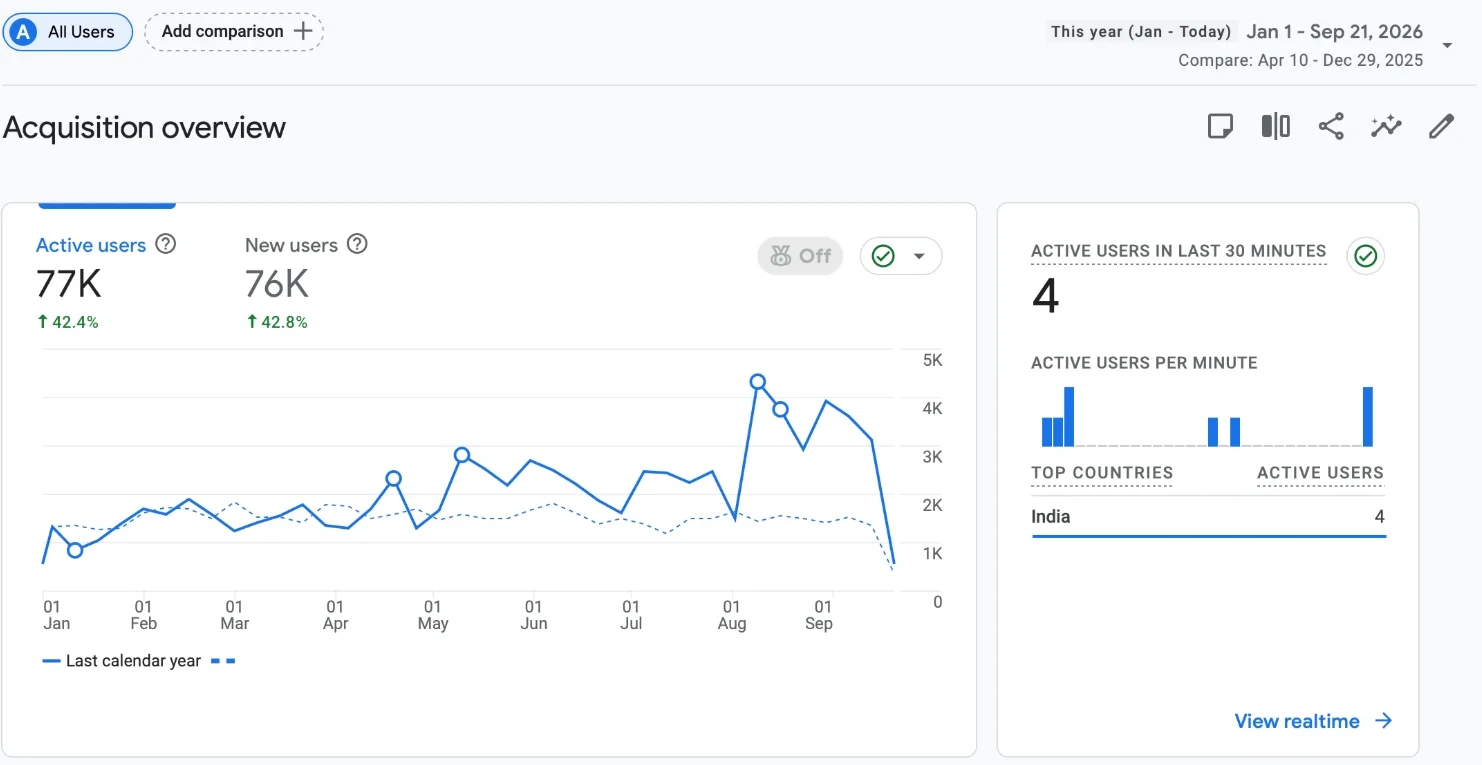
Across all traffic sources the site reached 77K active users, up 42.4%, and 76K new users, up 42.8%, against the same earlier window.
The more interesting movement is underneath the click total. Impressions, the number of times the site was shown in Google, fell 6.99%, from 987,614 to 918,576. Clicks rose on fewer impressions because the site now sits higher when it appears. Click-through rate went from 2.7% to 5.45%, and average position from 16.61 to 9.46. In plain terms, the site moved from page two to page one.
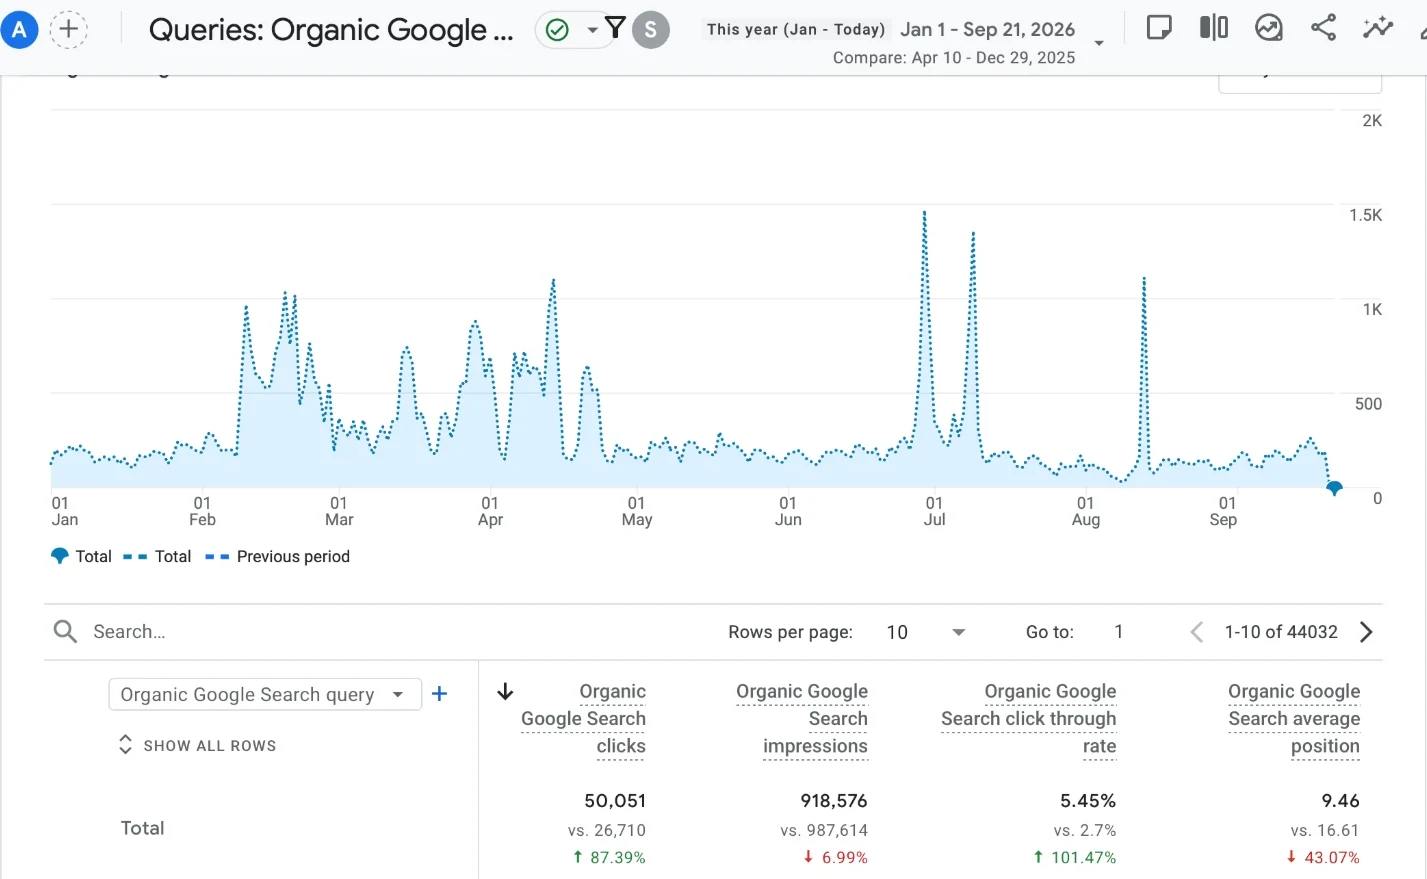
| Metric | Previous 264 days | 1 Jan to 21 Sep 2026 | Change |
|---|---|---|---|
| Organic Google clicks | 26,710 | 50,051 | +87.39% |
| Impressions | 987,614 | 918,576 | −6.99% |
| Click-through rate | 2.7% | 5.45% | +101.47% |
| Average position | 16.61 | 9.46 | Better by 43.07% |
Source: Google Analytics 4, Sirca property, captured 21 September 2026. Current window 1 January to 21 September 2026. Comparison window 10 April to 29 December 2025, the same 264 days. Figures are shown as Analytics reports them. Click-through rate change is relative, so 2.7% to 5.45% is shown as +101.47%. For average position a lower number is better.
The earlier case study covered 2022 to 2024 and reported visitors and business queries. This one covers 1 January to 21 September 2026 and reports Google clicks, impressions, click-through rate and average position.
Clicks from Google Search rose 87.39%, from 26,710 to 50,051, across two windows of 264 days each. It is not a year on year figure, and we have not adjusted for seasonality.
Because the site is shown in slightly fewer searches but much higher in the ones it appears for. Click-through rate went from 2.7% to 5.45% and average position from 16.61 to 9.46, so fewer impressions produced far more clicks.
It is a large improvement on 16.61 and it puts the site on page one on average. It is an average across a very long list of queries, so it hides a spread: some queries sit well above it and many sit below.
From Sirca’s Google Analytics 4 property, which sits in our Analytics account. The user figures come from the Acquisition overview. The click, impression and position figures come from the Search Console report inside Analytics. Both screenshots are on this page with the date range visible.
Send us the property and we will tell you what moved, what did not, and what we would look at first.
Talk to us
Awarded Digital Marketing Agency
Over 100
 reviews


